
Horse Racing Distances Explained: Lengths and Margins
Loading...
Distances between horses in racing results reveal information that finishing positions alone cannot convey. A winner by ten lengths has dominated; a winner by a short head has survived. Understanding how to read and interpret these margins transforms results from bare numbers into meaningful form data that informs future betting decisions.
Measuring the margins matters because British racing produces thousands of results each year. The 13,751 individual runners recorded in the first half of 2024 generated countless finishing margins that punters need to interpret. Across 1,410 annual fixtures, distances accumulate into a form database that rewards those who understand what the numbers mean.
The distance system uses horse-centric measurements that have remained essentially unchanged for centuries. A length represents a horse's body; fractions describe smaller gaps. These traditional measures provide intuitive understanding of how races unfolded—visualising the finishing picture from numerical data.
The Length System and Horse Racing Winning Margins Explained
One length approximates the body length of a thoroughbred racehorse—roughly eight to nine feet or about 2.5 metres. This measurement provides the baseline for all finishing margins. Results showing margins in whole lengths indicate clearly defined gaps between horses at the finish line.
Half lengths and quarter lengths subdivide the basic unit for closer finishes. A margin of two and a half lengths means the winning horse had crossed the line when the second horse's nose was roughly where the winner's hindquarters had been. These fractional measurements allow precise recording of moderately close finishes.
Time conversions help contextualise length measurements. At racing pace, one length translates to approximately one-fifth of a second on flat ground. A five-length winning margin represents roughly a second of daylight—significant in races where fractions separate multiple runners. Jump racing, with slower average speeds, sees lengths translate to slightly longer time intervals.
Large margins receive special terminology. Results showing "distance" indicate the beaten horse finished more than thirty lengths behind on flat or more on jumps—so far back that precise measurement becomes meaningless. A distanced horse has clearly not performed competitively, though circumstances such as falling behind early or encountering trouble might explain the margin.
The length system applies consistently across all British racing. Whether analysing sprint results from Ascot or staying chases from Haydock, the same measurements convey comparable information. This standardisation allows direct comparison of margins across different tracks and race types.
Short Margins: Heads, Necks, and Short Heads
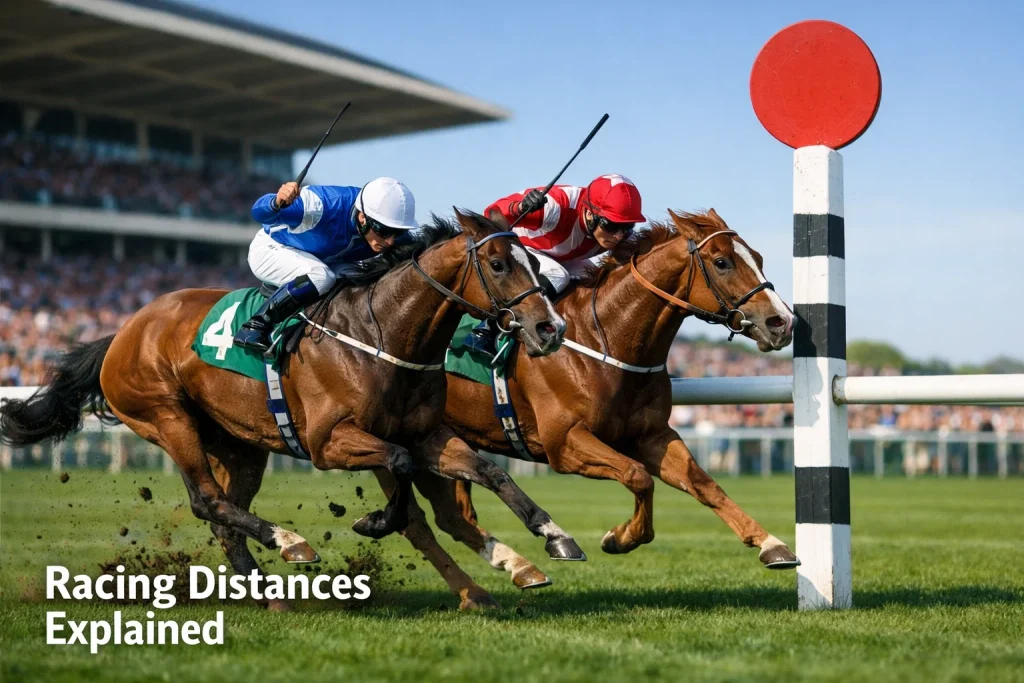
The shortest official margin is a short head—barely visible daylight between two horses' noses at the finish. Results showing this margin often require photo-finish technology to separate the runners. A short-head verdict indicates the race could easily have gone the other way with slightly different circumstances.
A head represents the length of a horse's head—approximately half a length or slightly less. Results decided by a head show close finishes where the winner established clear but narrow superiority. This margin suggests competitive racing without the absolute drama of a short head.
A neck falls between a head and half a length, reflecting the horse's neck measurement. Results showing neck margins indicate the winner had genuine daylight without establishing decisive superiority. Races finished by a neck often see the beaten horse running on well, suggesting different tactics might have reversed the result.
Dead heats occur when judges cannot separate two horses despite photo-finish analysis. Results record dead heats for first, second, or other positions, with stakes divided between connections and punters receiving reduced returns. Modern technology makes dead heats rare, but they still occur when simultaneous finishes defeat even sophisticated imaging.
Race Distances: From Sprints to Staying Tests
Race distances measured in furlongs and miles determine the nature of competition. One furlong equals 220 yards or 201 metres; eight furlongs make a mile. Results from five-furlong sprints test pure speed; results from three-mile chases examine stamina and endurance. The trip shapes both the type of horse required and the typical winning margins.
Sprint races over five and six furlongs typically produce smaller winning margins measured in lengths. The compressed distance means small advantages remain small—a horse gaining ground late has fewer furlongs to close gaps. Results from sprints often show tight finishes with multiple horses covered by a few lengths.
Middle-distance races from seven furlongs to a mile and a quarter balance speed and stamina. Margins in results vary more widely than in sprints as horses separate according to their relative abilities. Races at these distances often decide themselves in the final furlong, producing definitive but not enormous margins.
Staying races beyond a mile and a half see larger margins become common. The extended distance allows superior stayers to stretch clear once rivals tire. Results from extreme distances—two-mile flat races or three-mile chases—frequently show double-digit length margins as class tells over stamina-sapping trips.
Visualising Winning Margins
Picturing margins helps interpret results more intuitively. A short head represents centimetres of overlap between two horses' muzzles—the barest possible advantage. A head shows clear daylight between noses, perhaps the width of a hand. A neck suggests you could fit an arm in the gap.
A length gap means the winner had fully crossed the line before the second horse's nose reached it. Visualise one horse standing directly behind another—that space represents roughly a length. Two lengths doubles this gap; five lengths shows significant separation that would be clearly visible to trackside observers.
Ten lengths or more represents obvious superiority. At this margin, the second horse would be roughly a bus length behind as the winner crossed the line. Results showing such margins indicate either exceptional quality from the winner or weaknesses in the opposition—sometimes both.
Beyond twenty lengths, precise measurement loses practical significance. Results showing such margins often result from horses failing to see out the trip or encountering problems that compromised their performance. The focus shifts from analysing margins to understanding what went wrong.
Using Distances in Form Analysis
Margins reveal pace dynamics that raw positions obscure. Results where the first three finish within a length indicate a competitive race where any of them might have won. Results showing the winner clear with a tight group for second suggest one superior horse against an evenly matched remainder.
Cumulative distances help assess relative ability. Adding up margins between first and fourth shows whether the form spread widely or tightly. Results where four horses finish within three lengths differ fundamentally from results where a twenty-length gulf separates them—even if finishing positions appear similar.
Weight adjustments translate margins into performance comparisons. Form analysis often applies the formula that one pound of weight equals one length over a mile. Results showing a horse beaten two lengths while carrying seven pounds more than the winner suggest the defeated horse might have won at level weights.
Going conditions affect margin interpretation. Heavy ground produces bigger margins as tired horses lose ground more quickly; fast ground compresses fields as maintained speed preserves positions. Results from different conditions need adjustment when comparing form—a five-length win on soft might equal a two-length win on good.
Class levels influence expected margins. Results from Group 1 races typically show smaller margins as high-quality fields contain horses of similar ability. Results from modest handicaps often feature wider spreads as horses of varying quality compete together. Adjusting expectations to class level prevents misinterpretation of margins.